
2026
Week 18 · Sunday 1:00 PM ET · Paycor Stadium
 vs
Bengals offensevsBrowns defense
Season numbers through Week 8: 7 games for Bengals, 8 for Browns. Ranks are out of 32; #1 is the best offense or the stingiest defense.
Third downs favor Bengals
Bengals convert 55% of third downs (1st). Browns allow 40% (14th).
Deep left is open
Browns are worst against deep left throws, allowing +0.42 EPA per attempt. Bengals send 3% of their throws there. That is a small part of their offense so far.
Checkdowns go nowhere
Browns give up 18 yards a game to running backs (1st), against a league average of 32. Bengals' running backs produce 37 (10th).
Yards per play
Call this one even. Bengals gain 6.0 yards per play (6th). Browns give up 5.3 (11th), with the league at 5.4.
Players to watch
 Browns
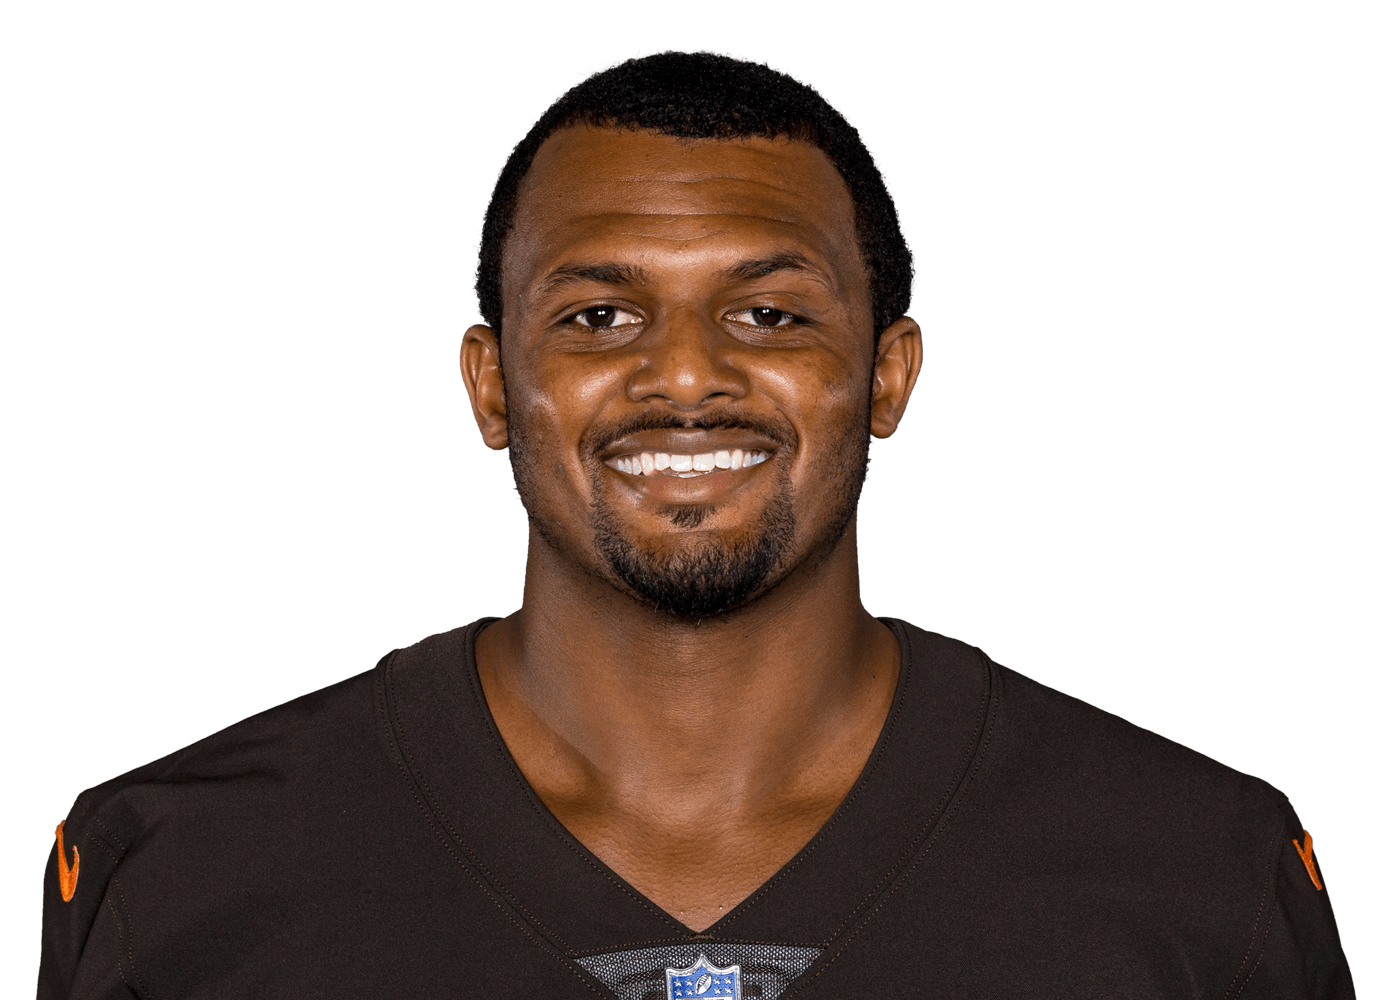 Deshaun WatsonQB · 163/249 · 1806 yds · 7 TD · 3 INTEPA per dropback -0.02 · 24th
 Quinshon JudkinsRB · 101 car · 342 yds · 3 TD · 21 recEPA per touch -0.15
 Denzel BostonWR · 26 rec · 409 yds · 3 TD · 53 tgtEPA per target +0.11
 Harold Fannin Jr.TE · 35 rec · 411 yds · 3 TD · 51 tgtEPA per target +0.26 · 17thDenzel WardLeft Cornerback · 29 tackles · 3 INT · 9 PD3 INT · T-2nd in the NFLMason GrahamLeft Defensive Tackle · 16 tackles · 4 sacks4 sacks · T-22nd in the NFL
 Bengals
 Joe BurrowQB · 195/267 · 2115 yds · 20 TD · 6 INTEPA per dropback +0.24 · 7th
 Chase BrownRB · 94 car · 340 yds · 1 TD · 36 recEPA per touch -0.21
 Ja'Marr ChaseWR · 43 rec · 492 yds · 6 TD · 61 tgtEPA per target +0.46 · 24th
 Tee HigginsWR · 43 rec · 726 yds · 4 TD · 61 tgtEPA per target +0.85 · 3rdBoye MafeLeft Defensive End · 18 tackles · 5.5 sacks · 1 PD5.5 sacks · T-9th in the NFLJordan BattleStrong Safety · 49 tackles · 3 INT · 6 PD3 INT · T-2nd in the NFL
The Bengals lead the series 32–22 since 1999. Jan 4, 2026, at Paycor Stadium: the Browns won 20–18. Joe Burrow started at quarterback for the Bengals and Shedeur Sanders for the Browns; Zac Taylor and Kevin Stefanski coached.
The last 5
| 2025 · Wk 18 | CLE 20 at CIN 18 |
| 2025 · Wk 1 | CIN 17 at CLE 16 |
| 2024 · Wk 16 | CLE 6 at CIN 24 |
| 2024 · Wk 7 | CIN 21 at CLE 14 |
| 2023 · Wk 18 | CLE 14 at CIN 31 |
2026 records
| Browns | Bengals | |
|---|---|---|
| Overall | 5–3 | 5–2 |
| Division | 2–1 | 1–1 |
| Conference | 3–3 | 4–2 |
| Other conference | 2–0 | 1–0 |
| Home | 3–0 | 2–1 |
| Away | 2–3 | 3–1 |
| Last 5 | WLWWL | LLWWW |
| Streak | Lost 1 | Won 3 |
| Points a game | 17.4 – 21.6 | 29.4 – 22.6 |
Every meeting since 1999, regular season and playoffs, from nflverse's game list, which starts in 1999; the all-time series goes back further. Franchises that moved count as one team (the Raiders, Chargers and Rams). Home and away are from the Browns' side. Records are this regular season.
Bengals offense · 3WR 1TE
- QBJoe Burrow#9 · 195/267 · 2115 yds · 20 TD · 6 INT
- RBChase Brown#30 · 94 car · 340 yds · 1 TD · 36 rec
- WRJa'Marr Chase#1 · 43 rec · 492 yds · 6 TD · 61 tgt
- WRTee Higgins#5 · 43 rec · 726 yds · 4 TD · 61 tgt
- WRDohnte Meyers#81 · 16 rec · 175 yds · 0 TD · 23 tgt
- TEMike Gesicki#88 · 17 rec · 241 yds · 6 TD · 24 tgt
- LTOrlando Brown Jr.#75
- LGDylan Fairchild#63
- CTed Karras#64
- RGDalton Risner#66
- RTAmarius Mims#71
Browns defense · Base 4-3 D
- RDEJared Verse#8 · 17 tackles
- RDTMaliek Collins#96 · 19 tackles · 3.5 sacks
- LDTMason Graham#94 · 16 tackles · 4 sacks
- LDEIsaiah McGuire#57 · 20 tackles · 3 sacks
- WLBEaston Mascarenas-Arnold#42 · 11 tackles
- MLBCarson Schwesinger#49 · 72 tackles · 1 sack · 1 PD
- SLBQuincy Williams#5 · 52 tackles · 1 sack · 3 PD
- RCBTyson Campbell#7 · 33 tackles · 3 PD
- LCBDenzel Ward#21 · 29 tackles · 3 INT · 9 PD
- NBMyles Harden#26 · 28 tackles · 1 INT · 6 PD
- SSGrant Delpit#9 · 34 tackles · 1 sack · 1 INT · 4 PD
- FSRonnie Hickman#33 · 48 tackles · 1 sack · 1 INT · 2 PD
Starters from each team's current depth chart (nflverse, from ESPN), drawn in the offense's base three-receiver set against the defense's base front. The nickel back, the extra defensive back most teams use against three receivers, is drawn lighter. Left and right are as the offense sees the field. The toggle at the top flips which offense is drawn.
| Stat | CIN off | Favors CIN · Favors CLE | CLE def allows | NFL avg |
|---|---|---|---|---|
| Overall | ||||
| EPA per play | +0.12#5 | -0.02#13 | +0.00 | |
| Success rate | 50%#2 | 42%#10 | 44% | |
| Yards per play | 6.0#6 | 5.3#11 | 5.4 | |
| Explosive play rate | 9%#21 | 12%#32 | 9% | |
| Passing | ||||
| Pass EPA per dropback | +0.23#5 | -0.03#9 | +0.03 | |
| Sack rate | 5%#8 | 7%#10 | 7% | |
| Running | ||||
| Run EPA per carry | -0.13#22 | -0.02#27 | -0.08 | |
| Yards per carry | 3.7#26 | 4.7#28 | 4.1 | |
| Money downs | ||||
| 3rd down conversion | 55%#1 | 40%#14 | 41% | |
| Red zone TD rate | 68%#9 | 52%#11 | 61% | |
| Targets by position | ||||
| WR yards per game | 211#1 | 138#13 | 147 | |
| TE yards per game | 54#17 | 59#23 | 55 | |
| TE targets per game | 7.0#21 | 8.0#21 | 7.6 | |
| RB receiving yards per game | 37#10 | 18#1 | 32 | |
Bengals: EPA per throw
Browns: EPA allowed per throw
Green gains more than expected, red loses value. Cells with fewer than 5 throws are grayed out.